


Core regulatory circuitry (CRC)-dependent transcriptional network is critical for developmental tumors in children and adolescents carrying few gene mutations. However, whether and how CRC contributes to transcription regulation in Ewing sarcoma is unknown. Here, we identify and functionally validate a CRC ‘trio’ constituted by three transcription factors (TFs): KLF15, TCF4 and NKX2-2, in Ewing sarcoma cells. Epigenomic analyses demonstrate that EWS-FLI1, the primary fusion driver for this cancer, directly establishes super-enhancers of each of these three TFs to activate their transcription. In turn, KLF15, TCF4 and NKX2-2 co-bind to their own and each other's super-enhancers and promoters, forming an inter-connected auto-regulatory loop. Functionally, CRC factors contribute significantly to cell proliferation of Ewing sarcoma both in vitro and in vivo. Mechanistically, CRC factors exhibit prominent capacity of co-regulating the epigenome in cooperation with EWS-FLI1, occupying 77.2% of promoters and 55.6% of enhancers genome-wide. Downstream, CRC TFs coordinately regulate gene expression networks in Ewing sarcoma, controlling important signaling pathways for cancer, such as lipid metabolism pathway, PI3K/AKT and MAPK signaling pathways. Together, molecular characterization of the oncogenic CRC model advances our understanding of the biology of Ewing sarcoma. Moreover, CRC-downstream genes and signaling pathways may contain potential therapeutic targets for this malignancy.
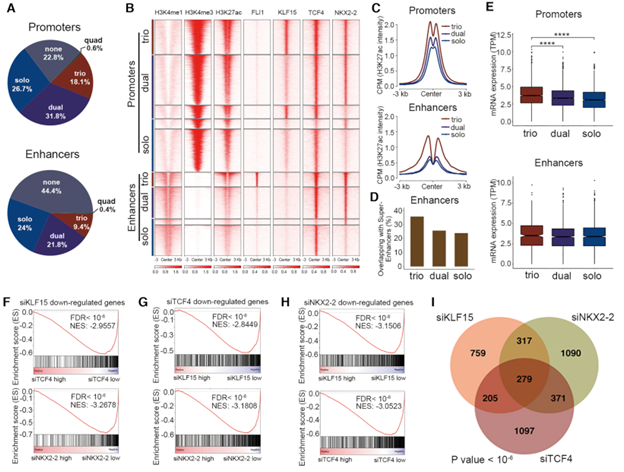
In the Figure, transcriptional cooperativity between EWS-FLI1 and CRC TFs. (A) Pie charts of the factions of combinatorial binding patterns of EWS-FLI1 and three CRC TFs. (B) Heatmaps of ChIP-Seq signals of indicated factors in A673 cells, stratified by different combinatorial binding patterns. (C) Line plots of H3K27ac ChIP-Seq signals from indicated groups of peaks in A673 cells. (D) The overlapping of indicated groups of peaks with super-enhancers in A673 cells. (E) Box plots of mRNA expression of genes associated with indicated groups of peaks in A673 cells. The nearest genes of enhancers were used. (F) GSEA plots showing the enrichment of downregulated genes upon knockdown of KLF15 in either siTCF4 or siNKX2–2 RNA-Seq data. Reciprocal GSEA plots of RNA-Seq following knockdown of TCF4 (G) and NKX2–2 (H) are similarly provided. NES, normalized enrichment score; FDR, false discovery rate. (I) Venn diagram of downregulated genes following silencing of each single TFs (P value < 10−6; empirical distribution test).
Quick Biology provided the service of the CHIP sequencing for this study.
ChIP-sequencing, also known as ChIP-Seq or ChIP-seq, is a method used to analyze protein interactions with DNA. It combines chromatin immunoprecipitation (ChIP) with massively parallel DNA sequencing to identify the binding sites of DNA-associated proteins. ChIP-seq is used primarily to determine how transcription factors and other chromatin-associated proteins influence phenotype-affecting mechanisms. Determining how proteins interact with DNA to regulate gene expression is essential for fully understanding many biological processes and disease states. This epigenetic information is complementary to genotype and expression analysis.
Quick Biology is a professional ChIP-Seq provider and will ensure the customer to get the most out of the sequencing project.
See resource:
Shi, X., Zheng, Y., Jiang, L., Zhou, B., Yang, W., Li, L., ... & Koeffler, H. P. (2020). EWS-FLI1 regulates and cooperates with core regulatory circuitry in Ewing sarcoma. Nucleic acids research, 48(20), 11434-11451.