


2021-04-26 By Quick Biology
Circulating tumor DNA (ctDNA) is an accessible biomarker for cancer detection, molecular stratification, therapeutic monitoring, and post-treatment surveillance. Compared to traditional tissue biopsy, ctDNA as liquid biopsy is minimally invasive and can be performed serially to monitor tumor evolution or response to any drug therapy. Due to these advantages, ctDNA is being rapidly adopted in precision medicine. However, ctDNA sequencing assays face major challenges such as cell-free DNA exists as small fragments, and only a small fraction (< 0.01-0.1 %) of cell-free DNA is tumor-derived as we call ctDNA. In addition, ctDNA sequencing assays are also affected by a range of experimental variables and artifacts.
In recent Nature Biotechnology, as part of the Food and Drug Administration-led Sequencing Quality Control Phase 2 (SEQC2) project or the fourth phase of the Microarray Quality Control consortia, the Oncopanel Sequencing Working Group reported the findings of a multi-lab, cross-platform evaluation of analytical performance among five industry-leading NGS-based ctDNA assays (Table 1, ref1). They evaluate each stage of the ctDNA sequencing workflow with simulations, synthetic DNA spike-in experiments and proficiency testing on standardized, cell-line-derived reference samples (Figure 1). Interestingly, detection has high sensitivity, precision, and reproducibility by all five assays when variant allele frequency is above 0.5%. Below this limit, detection became unreliable and varied widely between assays, especially low input in library preparation, false negatives were more common. This comprehensive evaluation of the analytical performance of ctDNA assays serves to inform best practice guidelines and provides a resource for precision oncology.
Table 1: Description of participating ctDNA assays. Information regarding five industry-leading ctDNA assays enrolled in the proficiency study (ROC, ILM, IDT, BRP, TFS). For each ctDNA assay is shown: the total size of all reportable panel regions (‘Reportable region’), the proportion of this that is within protein-coding positions (‘Coding’) and consensus target regions (‘CTR’), the number of known negative positions (‘Negatives’) and (‘Variants’). All region sizes are reported in kb. The reporting region of participating hybrid capture assays (ROC, ILM, IDT, BRP) ranged from 110 kb to 501 kb, which was much larger than that of the TFS amplicon panel (1.9 kb). All participating assays are for Research Use Only, not for diagnostic procedures.
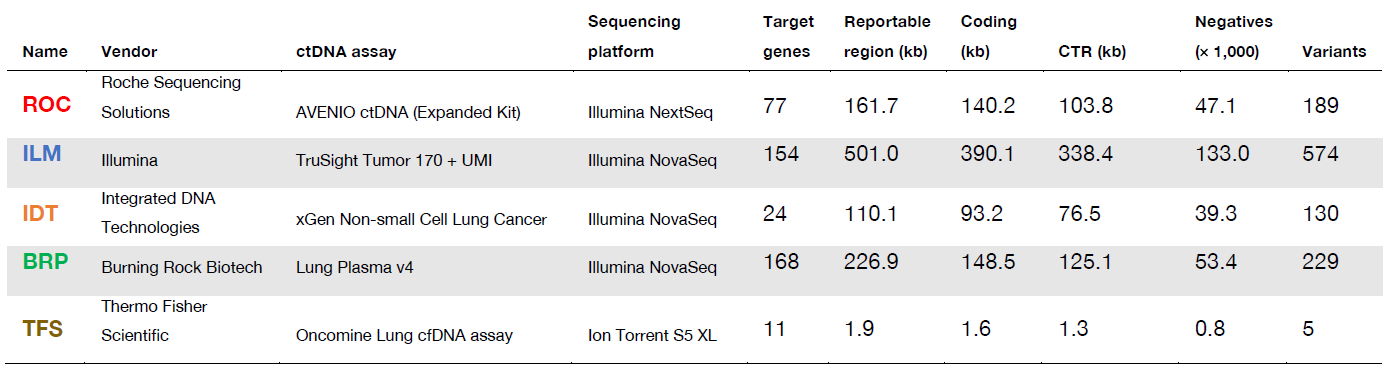
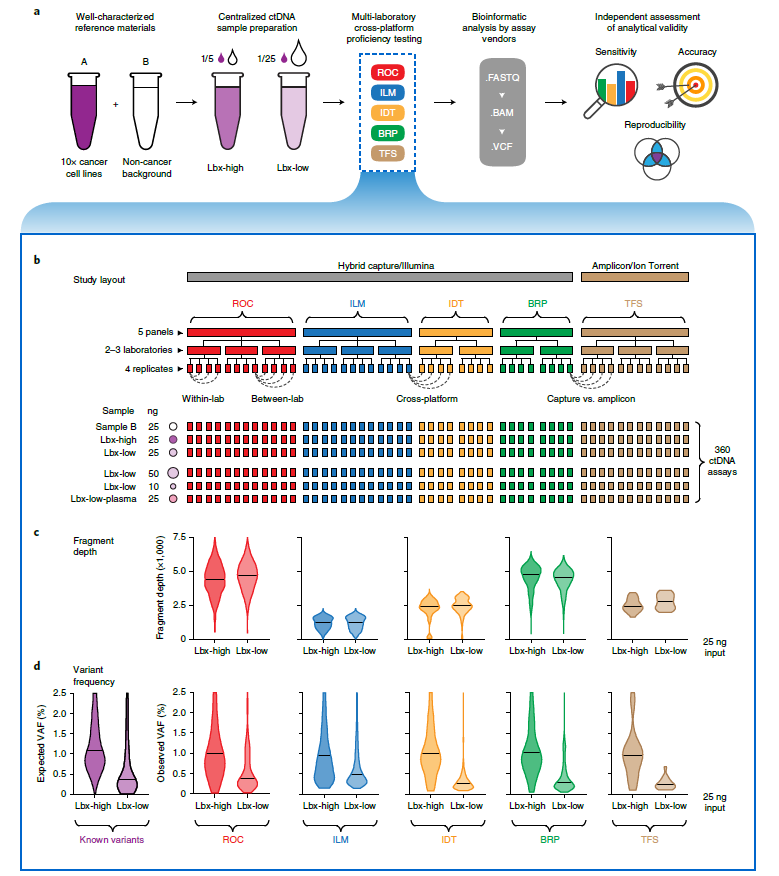
Figure 1: Structure of cross-platform ctDNA sequencing proficiency study. a, Schematic overview of the proficiency study. Briefly, contrived mock cell-free DNA samples (Lbx-high and Lbx-low) were administered to 12 test labs, where they were analyzed by one or more participating ctDNA sequencing assays. Bioinformatic analysis was performed by the relevant assay vendor using their custom pipelines. Results were then submitted for analytical evaluation by an independent team. b, Schematic overview of the proficiency testing scheme. Each participating ctDNA assay was performed at two or three independent test labs, with four technical replicates per lab generated for each test sample. Each of Lbx-high, Lbx-low, and Sample B were analyzed at a fixed 25 ng input amount, and Lbx-low was additionally analyzed at 10 ng and 50 ng input amounts and at 25 ng input after extraction from a synthetic plasma solution (Lbx-low-plasma). In total, 360 ctDNA assays were evaluated. c (upper), Violin plots show coverage distributions (unique fragment depth) for Lbx-high and Lbx-low (25 ng input) replicates in each participating assay. c (lower), Distribution of VAF for on-target variant candidates in Lbx-high and Lbx-low (25 ng input). For comparison, expected VAF distributions for known variants in Lbx-high and Lbx-low are also shown (lower left).
Quick Biology can assist you with ctDNA sequencing projects. Find More at Quick Biology.
See resource:
1. Evaluating the analytical validity of circulating tumor DNA sequencing assays for precision oncology. Nat. Biotechnol. (2021). doi:10.1038/s41587-021-00857-z