


2019-09-08 by Quick Biology Inc.
Single-cell RNA sequencing is one of the most popular sequencing methods in life science in those days. It has the potential to track the distinct cell lineages in development but is confounded by the absence of spatial (location) and temporal (developmental) resolution.
To achieve a spatial readout, in recent Nature, by low-input RNA-seq using the Geo-seq (Geographical position sequencing) protocol (Figure 1, ref 1), Dr. Han and Dr. Jing’s group reported a spatially resolved transcriptome of cell populations in mouse embryo development (ref 2). In their study, they systematically analyzed post-implantation development stages from pre-gastrulation (embryonic day (E)5.5) to late gastrulation (E7.5) on all germ layers in the embryo proper (Figure 2). Using SCENTIC (single-cell regulatory network inference and clustering) pipeline, and visualizing finer segregation of mesoderm and ectoderm by PCA and t-SNE methods, researchers revealed regulon switching at the branching points and the sequential transition of regulon usage, which indicates the intricate and dynamic molecular control of the specification of tissue fates in germ-layer development (Figure 3).
Figure 1: Geo-seq workflow from 2017 Nature protocols (ref 1).
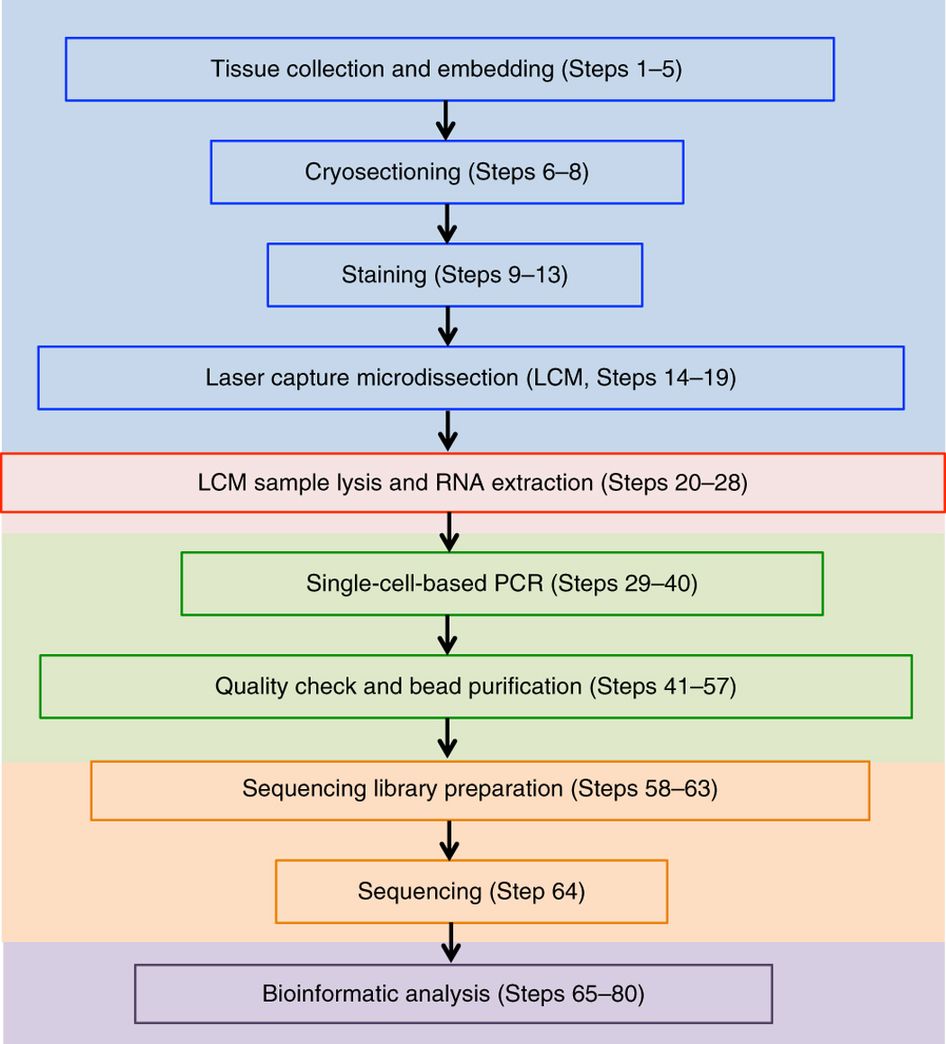
Figure 2: The spatial and temporal coverage of Geo-seq samples of E5.5-E7.5 embryos. A, anterior;P, posterior; L, left lateral; R, right lateral; L1, anterior left lateral; R1, anterior right lateral; L2, posterior left lateral; R2, posterior right lateral; Epi1 and Epi2, divided epiblast; M, whole mesoderm; MA, anterior mesoderm; MP, posterior mesoderm; En1 and En2, divided endoderm; EA, anterior endoderm; EP, posterior endoderm. S, sample section; R, reference section. Sn: sample section of level n. (ref 2) 
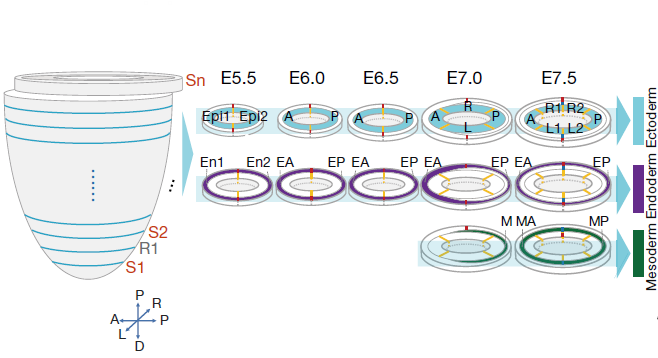
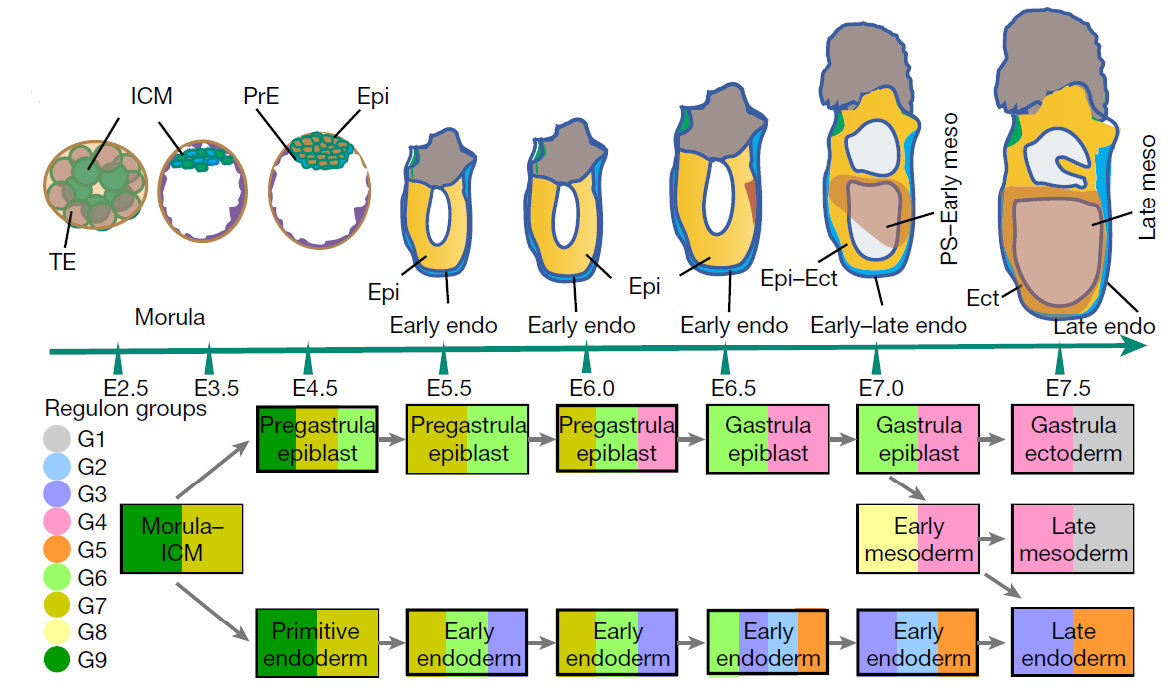
Figure 3: The molecular architecture and spatial relationship of the germ layer tissues. Below figure showing the connectivity of tissues underscored by the continuity of the regulon groups (G1-G9). MOR, morula; ICM, inner cell mass; PrE, primitive endoderm; TE, trophectoderm. Spatial domains: epiblast (Epi), Epi1–3; endoderm (En), E1–3; ectoderm, Ect1–3; mesoderm, M, MA and MP. (ref 2)
Quick Biology has extensive experience with low-input RNA sequencing, is an expert in NGS library preparation. Are you ready to sequence your samples of interest? Find More at Quick Biology.
Reference:
- 1. Chen, J. et al. Spatial transcriptomic analysis of cryosectioned tissue samples with Geo-seq. Nat. Protoc. 12, 566–580 (2017).
- 2. Peng, G. et al. Molecular architecture of lineage allocation and tissue organization in early mouse embryo. Nature 572, 528–532 (2019).